Key E-commerce Statistics for 2025

Did you know that 1.6 million new e-commerce websites have started until November 2024? This number definitely proves the importance of e-commerce in today’s world. So if you want to build strategies for growth in 2025, you are at the right place. In this blog post, we will share key e-commerce statistics to help you understand customer behavior and the most recent trends in e-commerce.
E-commerce Statistics: Market Leaders
The market leader countries are the United States and China. Their race is a multifaceted one, so it is difficult to point a finger. There are different aspects to consider, and the success rates of the two countries vary depending on those aspects.
- Chinese market value is the biggest in the world. In 2020, it went over one trillion U.S. dollars, and it is estimated to reach two trillion in 2027.
- Meanwhile, the American market value is expected to exceed 1.5 trillion U.S. dollars by 2026.
- The estimations based on sales suggest that Amazon, as the biggest e-commerce retailer in the U.S., is estimated to surpass Alibaba, the leader of the Chinese market, with over 1.2 trillion dollars worth of sales (Statista).
When it comes to cross-border e-commerce distribution:
- China is the leader with %30 of cross-border e-commerce. Followed by Germany at 14%, the United Kingdom and the United States at 10%, France at 4%, and other countries at 32%.

Source: International Trade Administration
This pie chart shows China's dominance in cross-border e-commerce mostly affected by low manufacturing costs and variety in products.
The cart also shows that Germany's economy is highly dependent on export since it is the second country with the most cross-border e-commerce purchases.
What makes the United States number three is most probably the popular brands appealing to international audiences.
Top Retail Websites
When we look at the distribution of online purchases worldwide, online marketplaces are at the top of the list according to the International Trade Administration. And, there are various websites for online shoppers to choose from, each of which offers different services and price ranges. Let’s take a look at the top 5 retail websites:
- As of November 2024, aliexpress.com continues to hold its position as the most visited retail website worldwide, with over one billion visitors (Semrush).
- eBay.com has lost its runner-up position and sits at number three, following amazon.de.
- Samsung.com is the 4th most visited website followed by amazon.co.uk (Statista).
When we look at the United States, Walmart is the number one website that has the most visitors followed by eBay, Etsy, Home Depot, and Best Buy.
The Reasons Why People Shop Online
Understanding user behavior and the reasons for that is an important point to consider to gain a competitive advantage and make strategic plans in the field of e-commerce.
So here are the top 10 reasons why people choose to shop online:
- 53.2% of internet users shop online because of free deliveries.
- 40.6% of web surfers prefer to shop online because of coupons and discounts.
- 33.2% of internet users shop online due to the reviews of other customers.
- 32.4% of internet users shop online because of easy return policies.
- 28.6% of web surfers shop online because it offers simple online checkout.
- 28.5% of internet users prefer online shopping because of next-day deliveries.
- 24.9% of internet users shop online because of loyalty points.
- 23.0% of web surfers shop online due to the likes and comments on social media.
- 18.7% of internet users prefer online shopping because of eco-friendly credentials.
- 17.0% of internet users shop online because of interest-free payments (Oberlo).
- By 2040, up to 95% of shopping will be facilitated by online businesses. (ResultFirst)
- 62% of people who own a smartphone have made an online purchase using their device in the past six months (Statista)
This list reveals what customers value the most. The top two factors show that customers are highly affected by cost-saving opportunities.
Easy return policies and next-day delivery prove the point that e-commerce is preferred because of its convenience.
Another important point that can affect your sales is customer reviews as seen in the list above. So building trust should be one of the priorities of your 2025 strategy.
Statistics for Online Shopping Activities
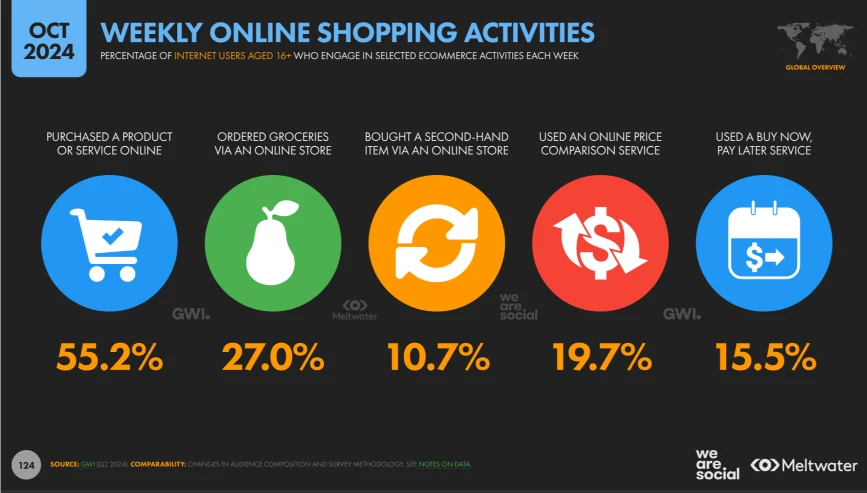
The Digital 2024 October Global Statshot Report reveals weekly e-commerce activities of internet users aged 16 and above.

Image Source: DataReportal
These weekly e-commerce statistics show that:
- 55.2% (the majority) of people using the internet indulge in online shopping activities each week.
- 27% of people order groceries online.
- Grocery items are the root of quick commerce. 27% indicates that online grocery shopping has boomed in popularity - especially after the pandemic - and is most likely to stick with us due to convenience.
- Second-hand items are also purchased online by 10.7% of people.
- 19.7% of people chose to compare prices using online comparison
services.
- This statistic reveals that customers are price-sensitive. That's why competitive offers and transparency are essential for success in 2025.
- This data not only indicates that people act cautiously but also shows people's inclination to use an online service that makes their lives easier.
- The 15.5% preferring buy now pay later services suggests that people are
turning towards flexible payment methods.
- So integrating different payment options can increase your sales in 2025.
Statistics for E-commerce in the United States
- 16.2% of total sales in the 3rd quarter of 2024 were e-commerce sales.
- According to the estimations, the revenue of the e-commerce industry in the U.S. will continuously increase until 2029 and reach 1.9 billion dollars (U.S. Census Bureau).
- A 36% increase is estimated in live commerce sales by 2026. (The sales made during live streams on social platforms are called live commerce.)
Quick commerce is on the rise in America. We have already mentioned that one of the main reasons people shop online is fast delivery. Seeing next-day delivery on the list above supports the estimation related to quick commerce:
- By 2027, quick commerce is expected to reach 40 billion U.S. dollars (Statista).
E-commerce Statistics for CAGR
CAGR (Compound Annual Growth Rate) demonstrates the average growth rate of e-commerce over a period of time.
Analyzing the growth rate over a certain period helps you see fluctuations and understand if they are temporary pikes. This statistic enables you to make future predictions, identify trends, and analyze your competitors. That's why it is crucial for businesses.
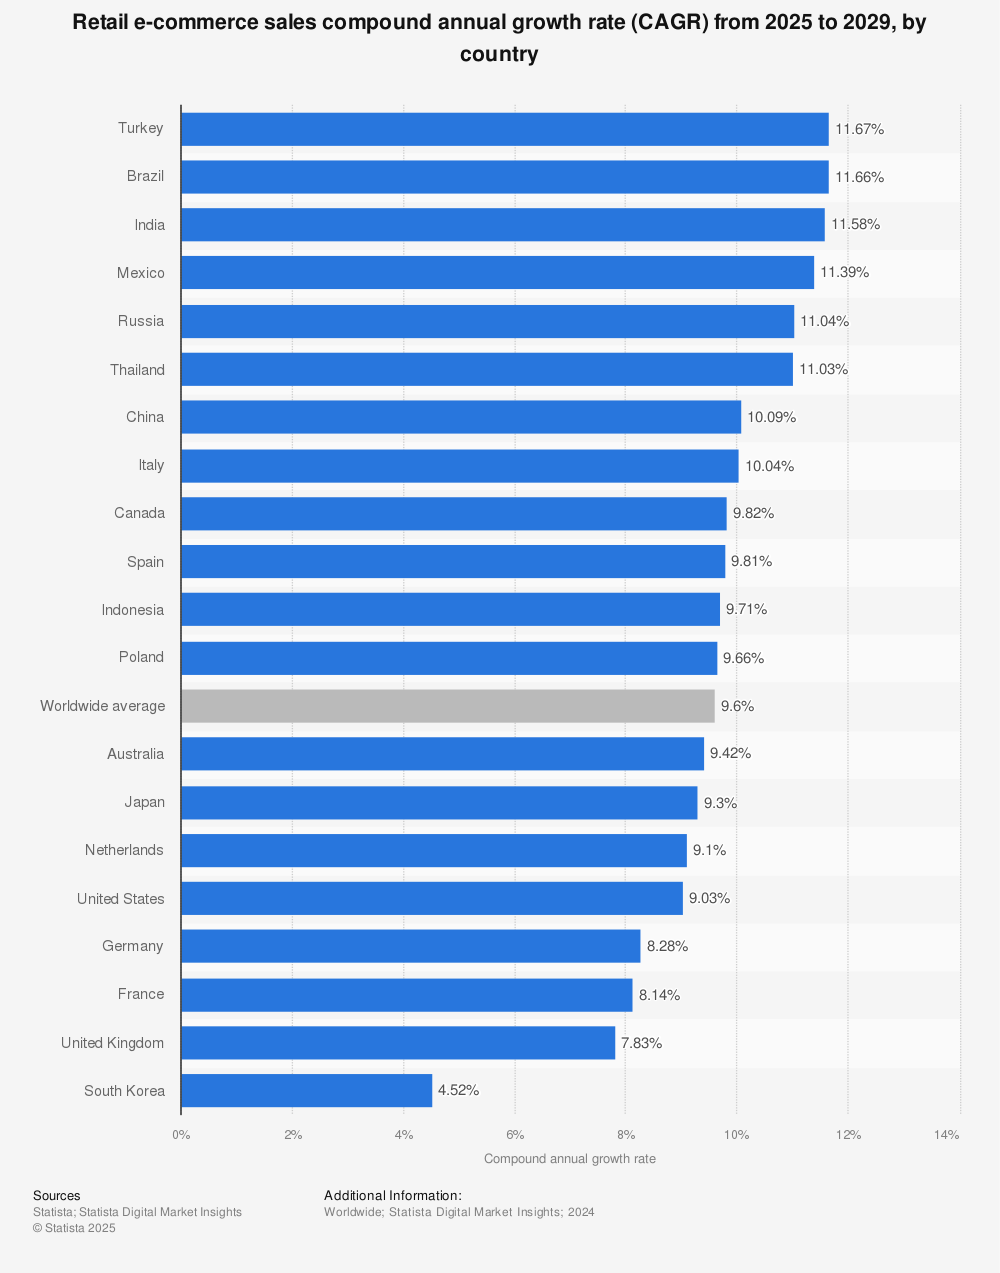
Here is a bar chart showing CAGR from 2024 to 2029:

Image Source Statista
Looking at the first three countries, we can say Eurasia, South America, and Asia are leading the e-commerce growth.
- In 2023, the Turkish market had a significant growth of 132%, and as seen on the chart, Turkey is expected to be the top country with 11.58% of e-commerce development between 2024 and 2029.
- Brazil follows Turkey with 11.56% and India comes right after with 11.45%.
- 9.49% of growth expected globally creates a benchmark for comparison.
The chart also shows that markets that have already proven their significance such as China, the United States, France, Germany, and the United Kingdom report lower growth rates. Only China out of these five countries is above the global average.
- While South Korea sticks out with a growth rate of 4.47%, that's probably because the country has already matured in terms of e-commerce and there isn't much room for significant growth.
How Videos Impact E-Commerce
Video content significantly boosts e-commerce performance across the board. It drives higher engagement, improves SEO rankings, and enhances customer trust, leading to up to 80% more conversions and a 41% higher click-through rate. With the majority of consumers relying on video before purchase, it’s no longer optional. It’s essential.
- 62% of consumers watch product review videos before making a purchase.
- 84% of consumers surveyed were convinced to buy a product or service after watching a brand’s video and more than half believe that companies should have video content on their sites.
- Including a video on your landing page can increase conversions by more than 80%.
- 97% of video marketers reported that video increased user understanding of a product or service, and more than 75% reported video helped them increase sales (How Video Helps Increase Conversion Rates).
- Video is 50 times more likely to get organic page ranks in Google than plain text results.
- 62% of Google universal searches include video.
- Video search results have a 41% higher click-through than plain text results.
- Posts with videos attract three times more inbound links than plain text posts (Cool Stats About Video SEO).
B2B E-commerce Statistics
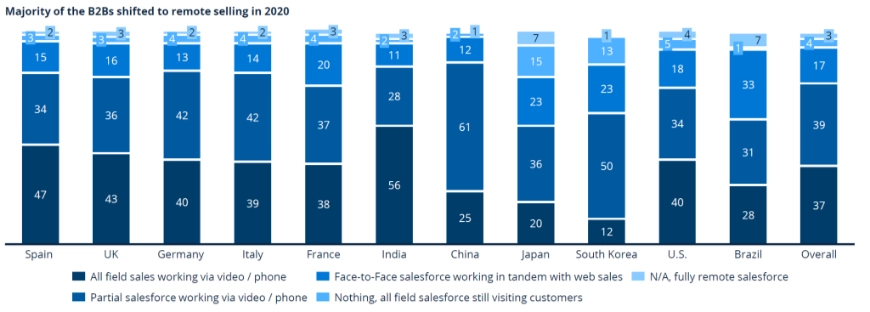
A shift towards virtual sales models happened during the pandemic.

Image Source: International Trade Administration
Overall:
- 37% of B2B sales forces shifted to video/phone methods (Forrester).
- 39% shifted to a hybrid model.
- 17% continued with face-to-face sales along with web sales.
In 2022, Forrester’s Buyers’ Journey Survey revealed that people who were born after 1980 were 64% of business buyers. And that percentage went up to 71% in the following year. This generation difference has been giving direction to e-commerce trends, and:
- It is expected for the 80% of B2B sales to take place on digital channels by 2025 (Gartner).
- The global B2B e-commerce market value is estimated to reach 36 trillion U.S. dollars by 2026 (International Trade Administration).
The Impact of Video on E-commerce Statistics & Conversion
Whether it’s a product review or a brand story, videos have the ability to engage potential customers, build trust, and boost conversion rates. The following e-commerce statistics demonstrate how powerful video content can be in influencing consumer behavior and driving sales.
- 62% of consumers watch product review videos before making a purchase.
- 84% of consumers surveyed were convinced to buy a product or service after watching a brand’s video and more than half believe that companies should have video content on their sites.
- Including a video on your landing page can increase conversions by more than 80%.
- 97% of video marketers reported that video increased user understanding of a product or service, and more than 75% reported video helped them increase sales (Business2Community).
Additionally, video content can significantly enhance your brand's visibility online. These statistics highlight how video improves SEO, generates higher click-through rates, and strengthens your overall online presence.
- Video is 50 times more likely to get organic page ranks in Google than plain text results.
- 62% of Google universal searches include video.
- Video search results have a 41% higher click-through than plain text results.
- Posts with videos attract three times more inbound links than plain text posts (Brainshark).
The Importance of Understanding Statistics
More and more businesses get into e-commerce because it enables them to reach customers beyond borders, and these online retailers have been changing the way we shop because of their convenience and variety. We can reach anything from groceries to footwear at our fingertips.
- As of 2024, there are 2.71 billion people around the world shopping online, and this number is expected to reach 2.77 in 2025.
- According to forecasts, 22.6% of our retail purchases will be online by 2027.
- Global retail e-commerce sales are expected to surpass eight trillion dollars by 2027
Understanding these estimations is key to realizing the impacts of e-commerce for businesses such as growth opportunities and scalability.
To sum up, statistics provide you with actionable insights on:
- market trends,
- consumer behavior,
- competitors,
- global opportunities,
- future growth.
You can make informed decisions, optimize your marketing strategies, improve customer experience, and drive innovation by recognizing key e-commerce statistics.
Frequently Asked Questions
What is the success rate of ecommerce?
CAGR estimations suggest that e-commerce is growing and will be growing in the future too. This might be interpreted as a high potential for success. However, multiple factors such as the niche, business strategy, and use of emerging technologies can affect the success rate of e-commerce; therefore, it is important to understand your field and the possible risks.
What are the challenges of e-commerce?
While e-commerce is continuously growing there a challenges it faces such as competition, building trust, managing supply chains, and protecting sensitive information. Plus, with the evolving digital landscape, the expectations of the customers evolve too, so it can be difficult to keep up with the expectations.
Will AI take over e-commerce?
AI has been transforming the field of e-commerce like all the other fields. AI-powered tools improve customer experiences and enhance operations. But still, human strategies are essential for success.
AI can help optimize many processes such as personalized recommendations, customer support, logistics management, and adjusting prices, but it won’t be taking over e-commerce entirely.

